CRM dashboards
Two dashboards read the enquiry and order records and show how selling is going.
Period
Both have the same period chips at the top: This month, Last month, This quarter, This FY, Last FY and All time. Figures are compared with the period before.
Pipeline Desk
Where: Operations → Sales → Pipeline Desk.
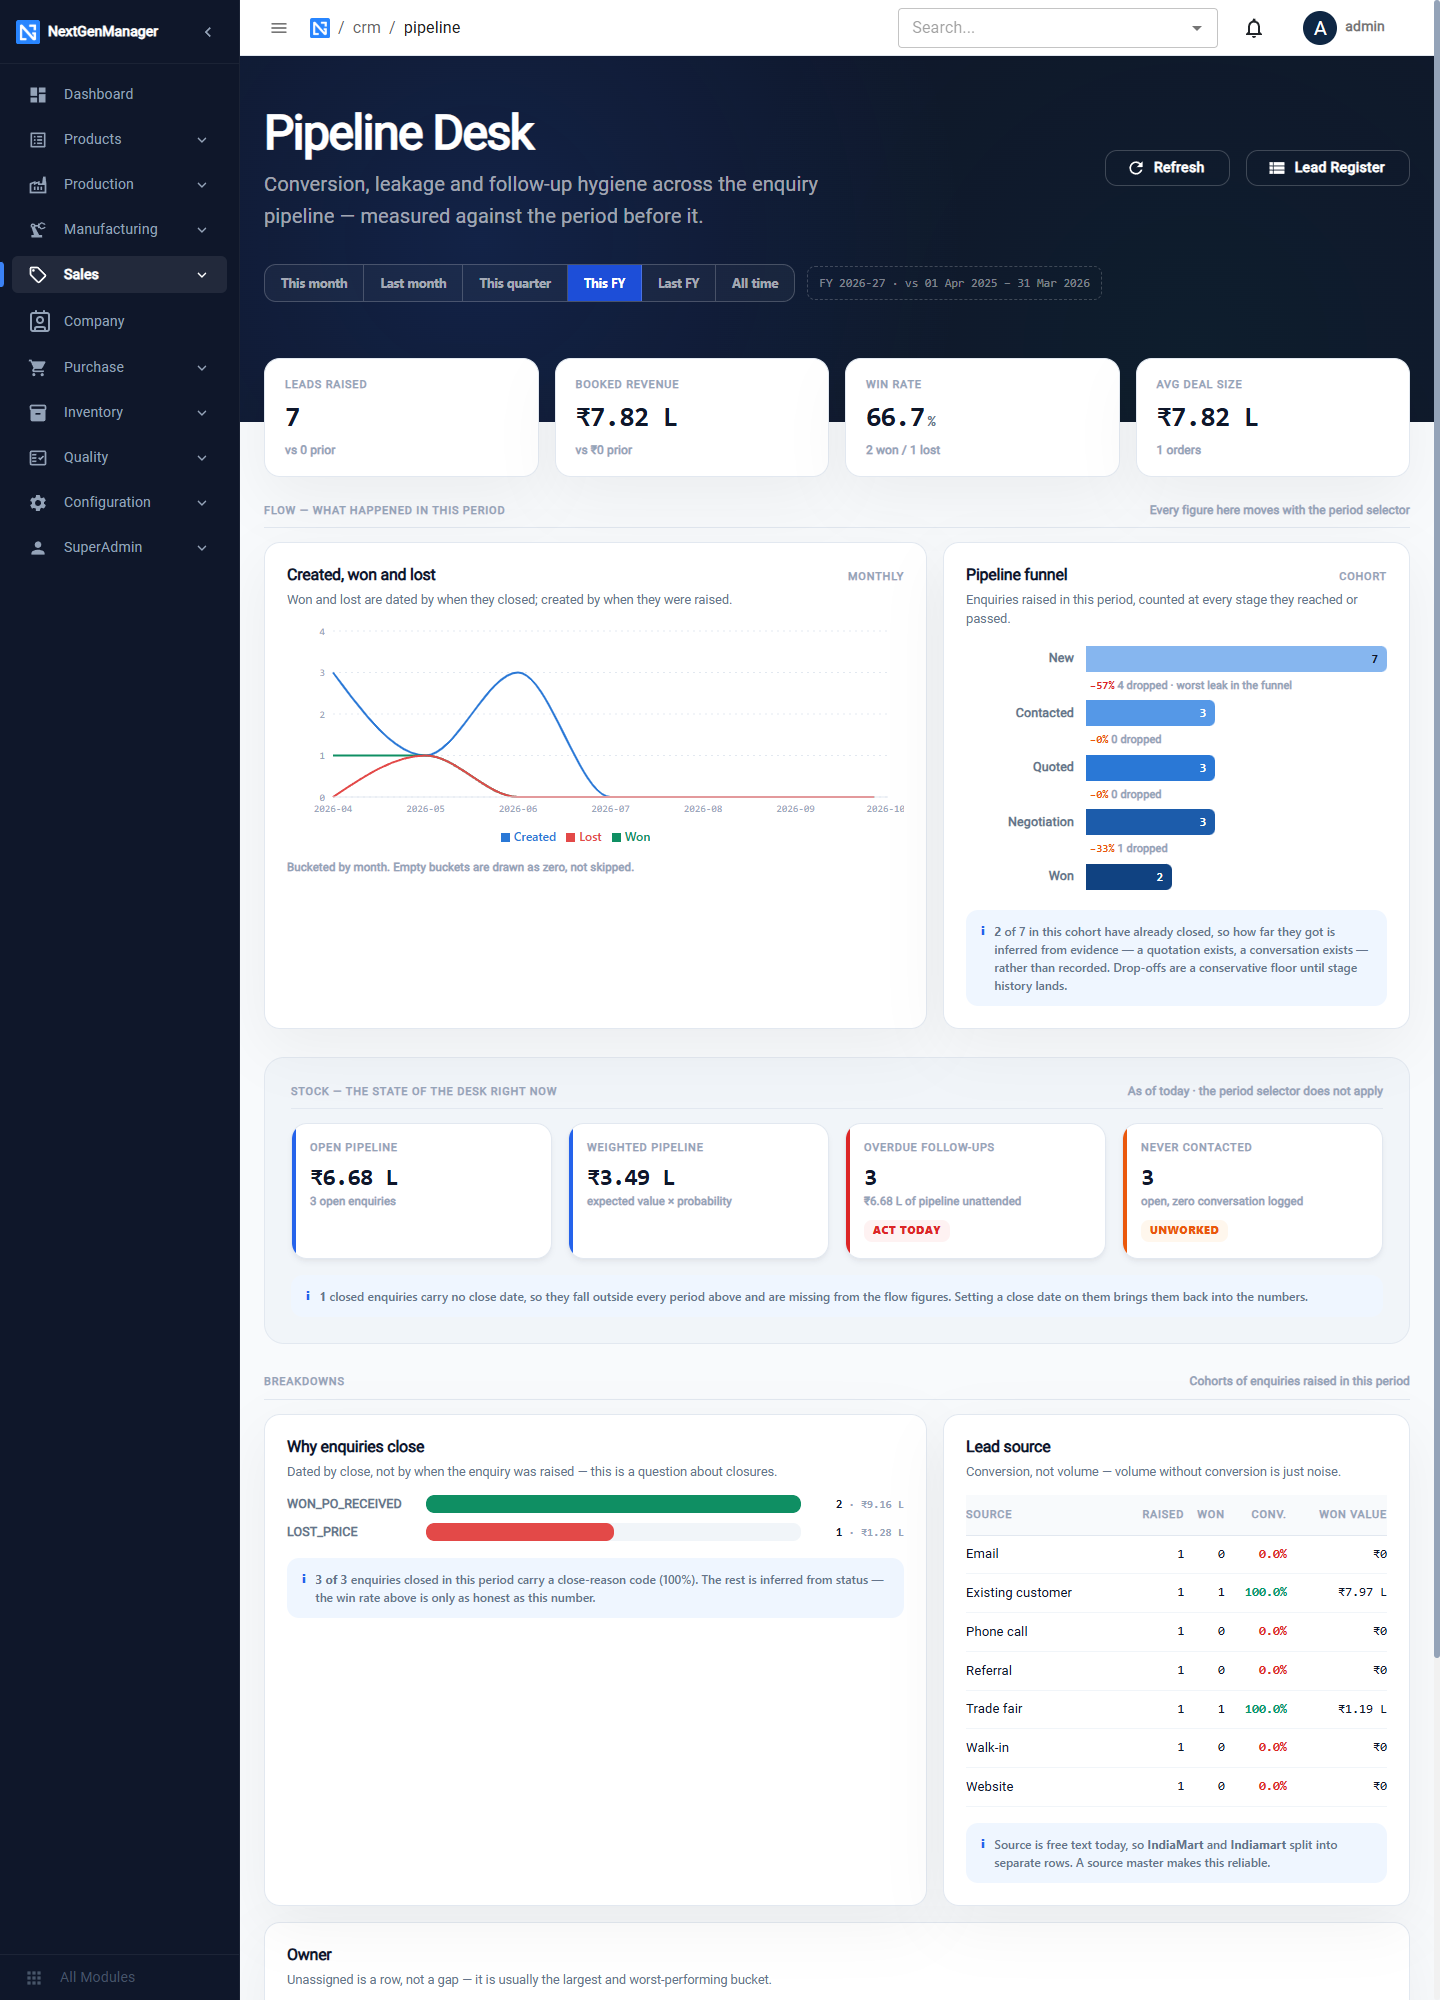
The page separates two kinds of figure.
Flow — what happened in this period. These move when you change the period.
| Figure | Meaning |
|---|---|
| Leads Raised | Enquiries created |
| Booked Revenue | Value of enquiries won |
| Win Rate | Won as a share of those closed |
| Avg Deal Size | Average value of a win |
| Created, won and lost | A month-by-month chart |
| Pipeline funnel | New → Contacted → Quoted → Negotiation → Won, with the drop-off at each stage |
Stock — the state of the desk right now. These do not change with the period.
| Figure | Meaning |
|---|---|
| Open Pipeline | Value of enquiries still open |
| Weighted Pipeline | Open value × probability |
| Overdue Follow-ups | Follow-up date has passed |
| Never Contacted | Open enquiries with no activity logged |
Notes on the page explain when a figure has been inferred, for example when an enquiry skipped a stage.
Lead Register takes you to the enquiry list.
Revenue Desk
Where: Operations → Sales → Revenue Desk.
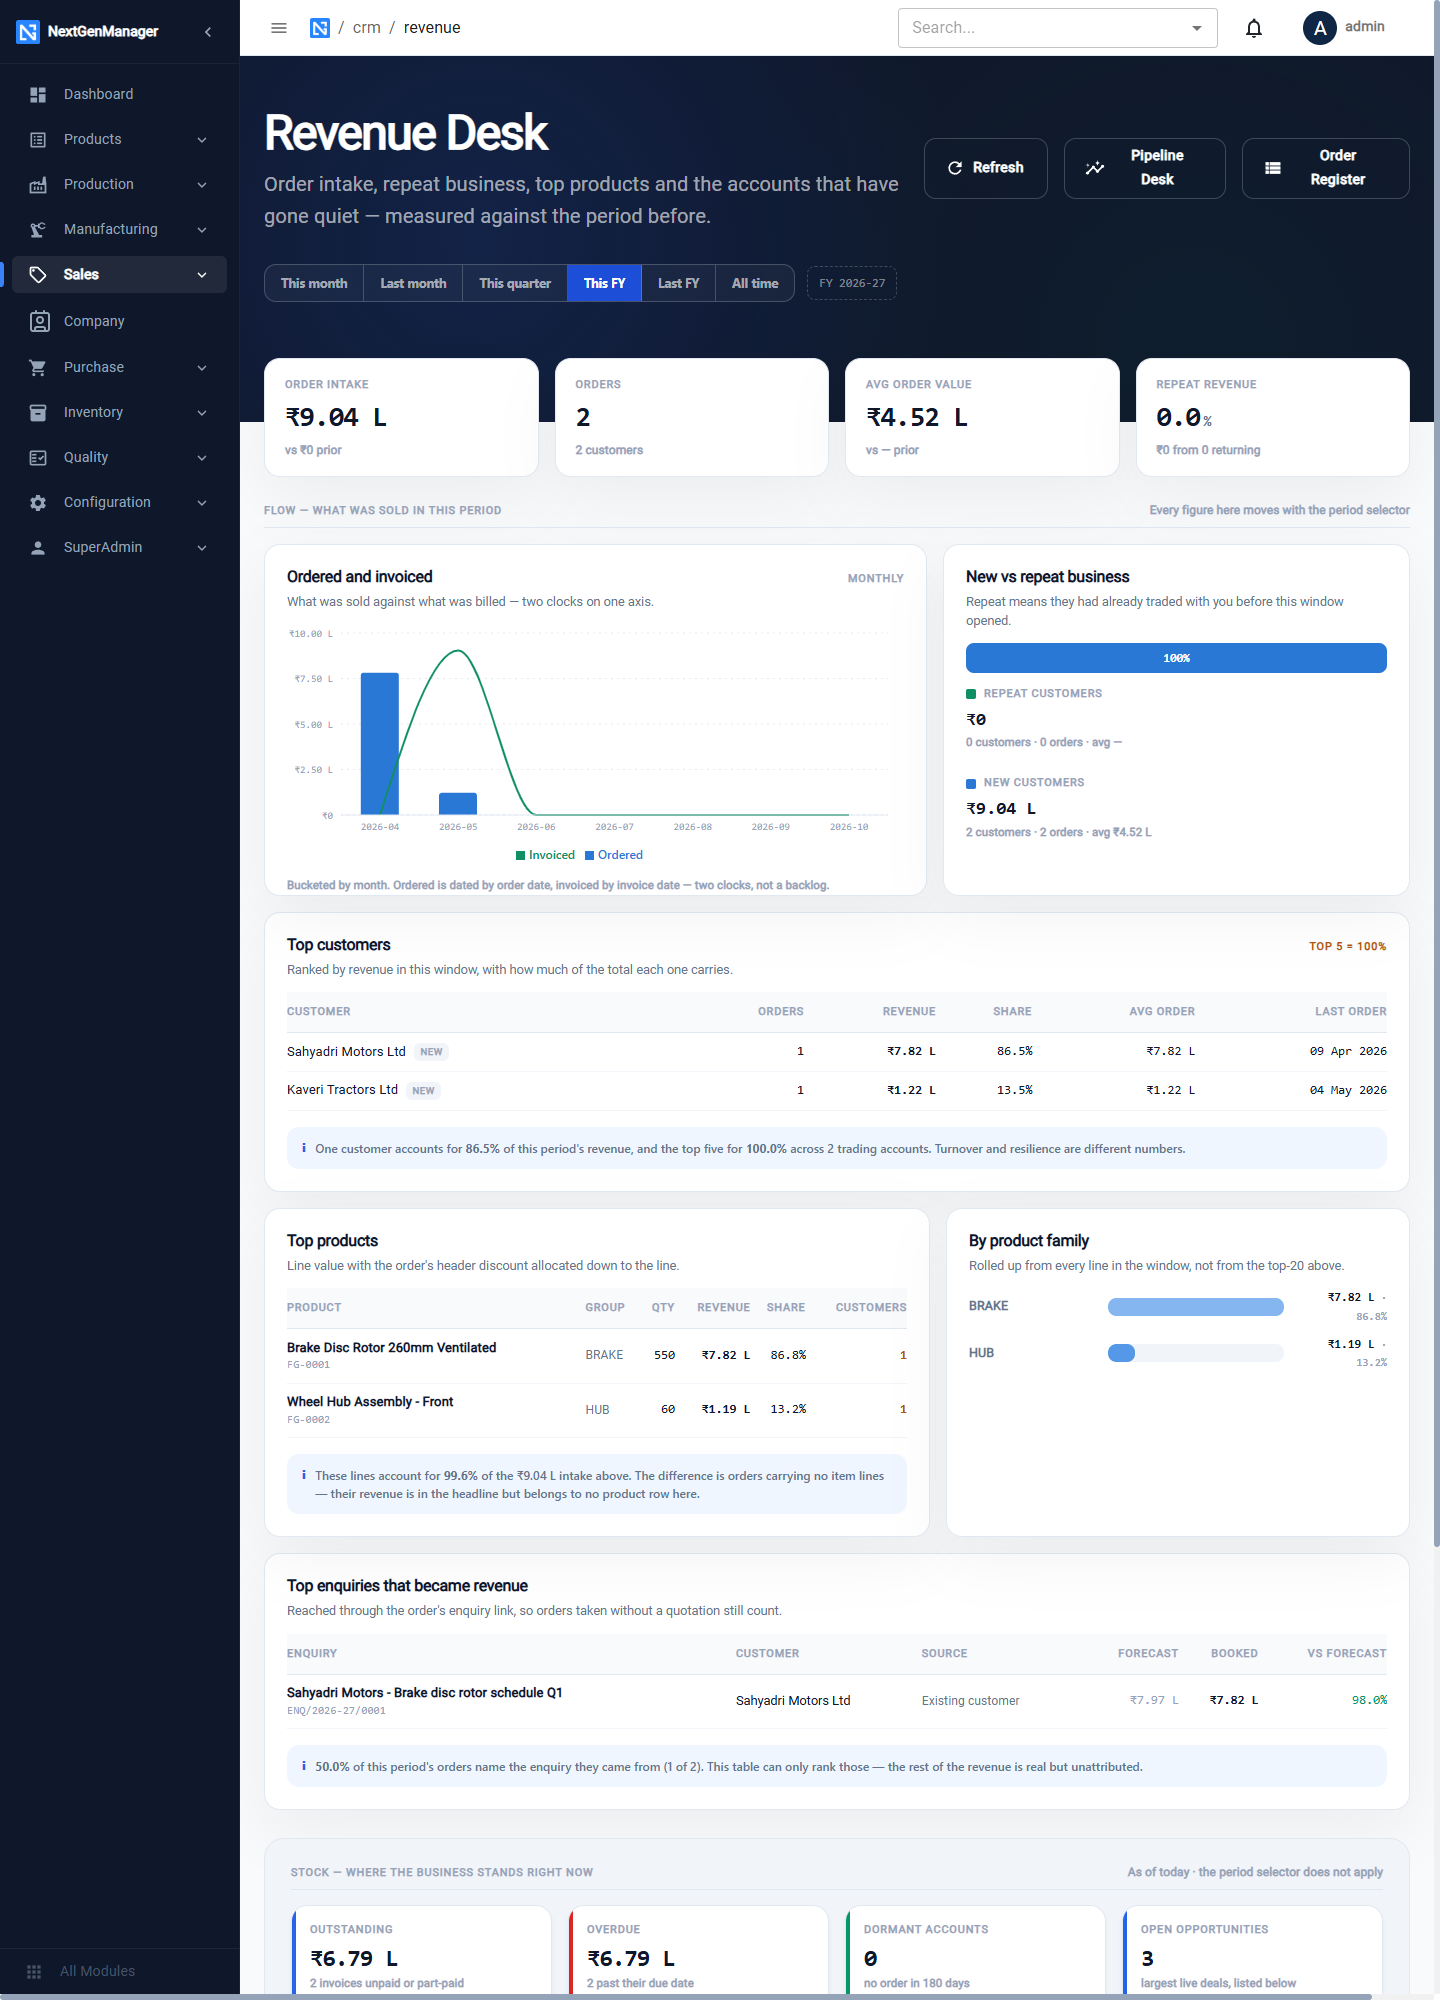
| Figure | Meaning |
|---|---|
| Order Intake | Value of sales orders taken |
| Orders | Number of orders and customers |
| Avg Order Value | |
| Repeat Revenue | Share of revenue from customers who have ordered before |
| Ordered and invoiced | Month by month: what was sold against what was billed |
| New vs repeat business | |
| Top customers | Orders, revenue, share and last order date |
| Top products | By revenue |
Pipeline Desk and Order Register at the top jump to those screens.
:::tip Keep the source records tidy These dashboards are only as good as the enquiries behind them. Set the stage, the value, the follow-up date and, when an enquiry ends, the close reason. :::